
How we analyze robot behavior with LLMs
 Back to blog
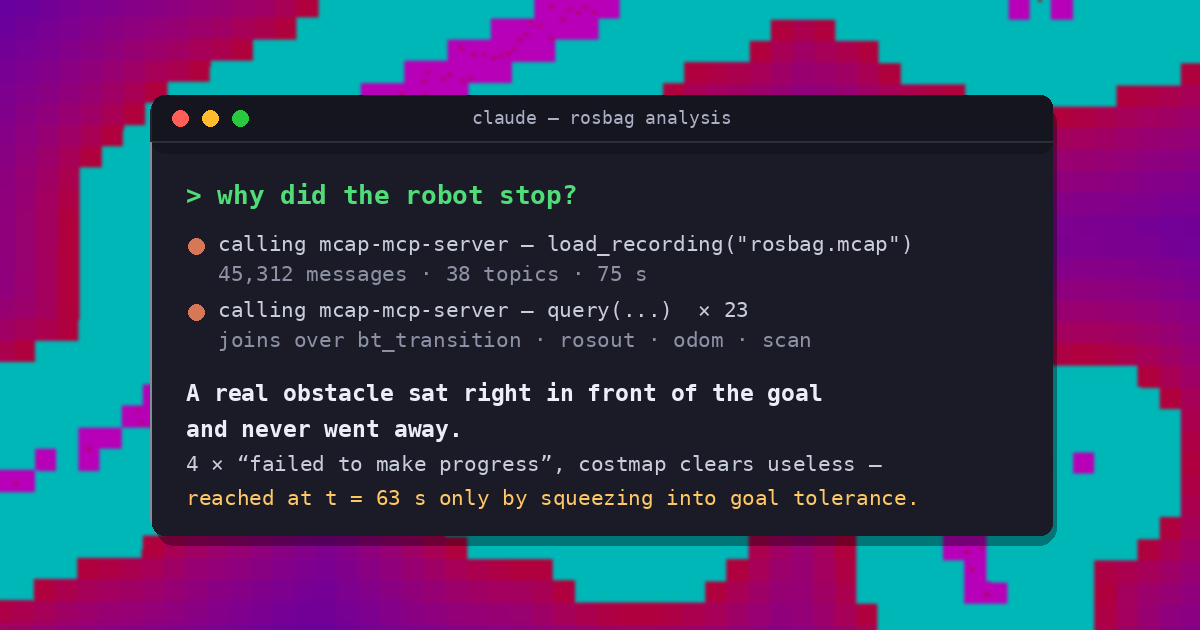
In all robotics, sometimes things don't work as expected: A robot stops or a mission times out. The reasons can be manifold — environmental, related to the specific robot hardware, or its software. In any case, someone has to figure out why. For ROS projects, the answer is usually in the rosbag. It contains all relevant info on the behavior trees, input and output of planners, controllers, and safety layer. However, extracting the answer out of this bag can be a time-consuming task.
In this post we'll show how we've largely automated that hour away. Today, "why did the robot abort mission 2143" is a question we type into an LLM agent, and three minutes later we get a timeline, a root cause, and the queries that prove it. This post explains how it works, what we had to build (all of it open source), and why the core trick is a 40-year-old query language.
LLMs can't read a rosbag (and shouldn't)
Now, one can't just simply hand over a rosbag to the LLM and tell it "figure out why it stopped". A modest 75-second test bag is 450 MB and 45,000 messages. No context window holds that, and even if it did, token-streaming raw odometry into a transformer is a spectacularly wasteful way to compute "why did it stop".
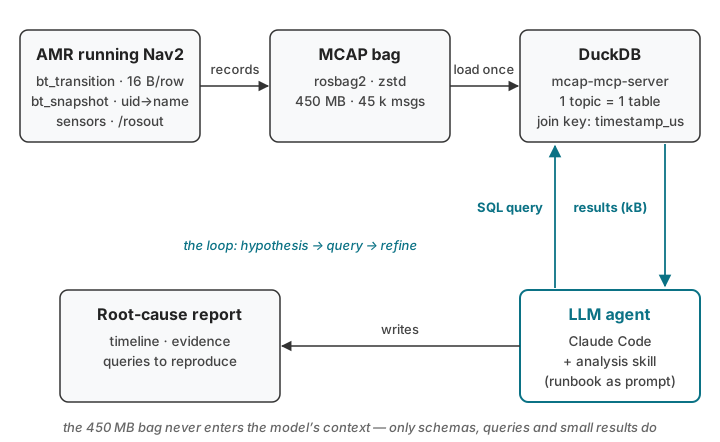
But one can also view rosbags as (time-series) databases: Every topic a table, every message a row, and rows have timestamps. Cross-topic questions — "what was the behavior tree doing when velocity dropped to zero?" — are simple joins. Now, luckily modern LLMs are great at writing SQL queries to databases.
By transforming the rosbag into a database (such as with mcap-mcp-server) and exposing a query tool via MCP, the LLM never sees the bag but instead can ask questions in SQL and get very targeted results. A 450 MB bag becomes a conversation of kilobyte-sized results. This also allows the model to iterate quickly: hypothesis, query, refine — the same loop a human expert runs, just faster and without the coffee.
Making the behavior tree queryable
Our robots use the (amazing) Nav2 navigation stack and are driven by behavior trees. The BT is thus where the robot's decisions live. Naturally, this is a significant part of the root-cause analysis. Currently Nav2 publishes a BT log topic, but it batches all of a tick's status changes into one message. As a database row that's an array blob: to join it against anything you first have to unnest it and re-timestamp every event. Our nav2 fork adds a transition logger that publishes the stream in database shape instead:
-
bt_transition— one message per node status change: node uid, previous status, new status. 16 bytes each. The message is the fact-table row. -
bt_snapshot— every few seconds, the full tree: every node's uid, name, type and current status. This is the dimension table (the mcap server auto-materializes it as abt_node_nameslookup), and because it's latched, a recorder that starts mid-mission still gets the mapping.
It's enabled by a single parameter
(enable_bt_transition_logging, analogous to Nav2's
enable_groot_monitoring) and adds very little overhead
to rosbags.
Finally, we wrap the recurring analysis recipes — finding the goal lifecycle, joining BT state against velocities, the usual first queries — in an agent skill. We share a generic version of it in our bt-rosbag-analysis repository.
Example 1: "Why didn't the robot reach the goal?"
Let's look at a few examples to understand what the LLM does with the mcap-mcp-server: A navigation goal in the Nav2 test simulation takes 63 seconds instead of ~25. We ask the agent why.
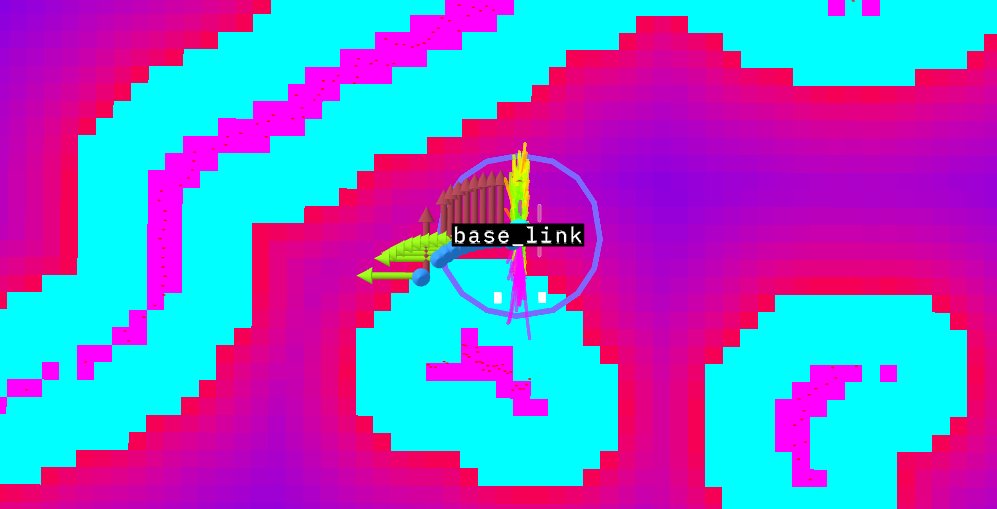
Result:
The path was blocked by a real physical obstacle sitting right in front of the goal — and it never went away. The robot stalled ~0.28 m short of the goal for ~35 seconds, burned through four "failed to make progress" aborts and several useless costmap-clear recoveries, and only succeeded ("Goal succeeded" at t = 63.3 s) because a spin recovery let it creep just close enough to satisfy the goal tolerance.
Timeline
All times are relative to t = 0, the moment the navigation goal was accepted.
| Time | Event |
|---|---|
| 0 s | Goal accepted: from (−2.0, −0.5) to (1.5, 1.2) in map, ~4.2 m, replanning at 1 Hz |
| 6 s onward | Path validation failed warnings, with the invalid pose index shrinking steadily (149 → 131 → … → 8) as the robot drives — one fixed spot on the path was occupied the whole time, ~0.3 m before the goal |
| ~22–58 s | Robot pinned at 0.28 m from the goal (odom speed < 0.01 m/s). The lidar shows a real return at ~0.25 m throughout — a genuine obstacle, not a costmap phantom. cmd_vel_nav ≈ cmd_vel, so the collision monitor wasn't the limiter: MPPI simply refused to drive into lethal cost, while every replan produced the same blocked path |
| 28.2 s, 38.3 s, 48.7 s, 58.8 s | The controller server aborts FollowPath four times with error 105 "Failed to make progress". Each abort triggers the BT recovery branch's costmap clears — pointless against a physical obstacle, which the scan re-inserts immediately |
| ~60 s | A Spin recovery runs; afterwards the robot inches forward from 0.28 m to 0.16 m from the goal |
| 63.3 s | The goal checker accepts: "Reached the goal!" — while path validation was still failing (invalid index 2) one second earlier. The robot ended up inside the goal's xy tolerance; it never got past the obstacle |
Root cause
The goal itself was (nearly) occupied — something stood ~25 cm in front of the goal pose for the entire run. Because it sat on the goal approach, the planner had no alternate route: every replan produced the same blocked path, and nav2 spent ~40 seconds in abort/recovery cycles. The costmap-clearing recoveries were the wrong tool for a physically present obstacle; the only recovery that helped was the spin, which mostly reset the progress checker and re-oriented the approach — the mission "succeeded" on goal tolerance, not because the path ever cleared.
As a bonus, the analysis surfaced a bug we hadn't asked about:
the recovery fallback spins hot before selecting the spin
behavior — WouldAPlannerRecoveryHelp ticked to
FAILURE ~380 times, ~100 times per second around t = 59 s. That
subtree's rate limiting is now on our list.
Example 2: from debugging to fleet metrics
Using the database, also more specific questions can be asked. As an
example, to investigate controllers, we can check the time between
starting control and first robot movement: How long after the BT
activates FollowPath does the controller actually
command motion? One time-based join between transition rows and
/cmd_vel:
| FollowPath activated (s) | First motion after (ms) |
|---|---|
| 0.02 | 50.0 |
| 28.19 | 128.4 |
| 38.68 | 89.1 |
| 48.71 | 208.6 |
| 60.68 | 39.2 |
Two things fall out of a toy bag: FollowPath ran
five times for one goal (the retry structure of the
incident above, visible without reading a single log line), and
controller reaction latency varies four-fold, spiking exactly when
the robot was boxed in. Run this over a week of fleet bags and the
daily maximum becomes a controller-health dashboard — a driver update
that adds 300 ms of startup lag becomes visible the morning
after it ships.
Summary: Useful properties of using SQL to analyze mcap rosbags
- It compresses. A GROUP BY turns 45,000 messages into five rows. The LLM's context holds conclusions, not data.
- It's declarative. The model states what it wants; DuckDB figures out how. No iterator-and-buffer Python for the model to get subtly wrong.
- Time is a join key. DuckDB's ASOF JOIN answers "what was X doing when Y happened" — the fundamental question of robot debugging — in one clause.
- The model already speaks it. We wrote zero lines of "teach the LLM our API" glue. The schema listing is the documentation.
Try it yourself
-
Install uv
(
curl -LsSf https://astral.sh/uv/install.sh | sh). -
Clone the
bt-rosbag-analysis
repo and start Claude Code inside it —
.mcp.jsonwires up the mcap-query server automatically. - Ask: "analyze the rosbag at /path/to/recording.mcap — why did the robot stop?"
Use this with any rosbag — the nav2-related changes are optional to improve analysis of behavior trees. They need to be enabled during bag recording.
- Nav2 BT transition logging: branch with the transition logger
- SQL over MCAP: mcap-mcp-server
- The agent skill: bt-rosbag-analysis
Interested in more information, or curious on how to automate pallet transportation in your warehouse? We'd love to hear from you — contact us.